Neutrinos
Background reading for Day 2 — no prior physics knowledge assumed.
The ghost particle
A neutrino is passing through your body right now. Trillions of them, every second — mostly produced by nuclear reactions in the Sun. And you have absolutely no way of knowing.
That's because neutrinos are nearly massless and carry no electric charge. They don't feel electromagnetism (so they ignore magnetic fields and don't interact with electrons). They don't feel the strong nuclear force (which binds atomic nuclei together). The only force they respond to is the weak nuclear force — one of the feeblest forces in nature.
The result: a neutrino can pass through a light-year of solid lead and only have a 50% chance of interacting. Detecting them requires enormous detectors — and a lot of patience.
Intresting fact: A banana radiates about 1.2 million neutrino each seconds (radioactivity of Potassium).
Three flavors
Neutrinos come in three varieties — called flavors — each associated with a different charged partner:
| Neutrino | Partner |
|---|---|
| Electron neutrino (νₑ) | Electron |
| Muon neutrino (νμ) | Muon |
| Tau neutrino (ντ) | Tau |
For most of the 20th century, physicists assumed these were distinct, fixed identities. Then came a surprise.
History of Neutrinos
- 1930 – Wolfgang Pauli hypothesized a mysterious particle.
- 1934 – Enrico Fermi named it “neutrino”.
- 1935–1939 – Goeppert Mayer & Majorana predicted double beta decay (two neutrinos emitted) and suggested neutrinos could be their own antiparticles (Majorana particles).
- 1956 – First detection by Reines & Cowan using a nuclear reactor.
- 1957 – Bruno Pontecorvo predicted neutrino oscillations.
- 1958 – Left-handed property discovered, a property by their spin.
- 1962 – Muon Neutrino Discovered: Scientists discovered a second type of neutrino.
- 1968 – Solar Neutrinos: Ray Davis detected neutrinos from the Sun, but found only 1/3 of expected, sparking the solar neutrino problem.
- 1973 – Neutral currents at CERN showed the existence of a new force carrier, Z boson.
- 1975 – Tau neutrino predicted, discovered in 2000.
- 1985–1987 – Atmospheric & supernova neutrinos observed.
- 1998 - Neutrino Oscillation confirmed, Super-Kamiokande proved neutrinos have mass.
- 2002 – Solar Neutrino Mystery Solved: Sudbury Neutrino Observatory confirmed neutrinos change flavor on the way to Earth.
- 2005 – Geoneutrinos Discovered: Neutrinos from Earth’s interior reveal hidden radioactive processes.
- 2010–2015 – Neutrino Oscillations & OPERA: Muon neutrinos transform into tau neutrinos; oscillation discovery earns Nobel Prize.
- 2012 – Big Bird Neutrino: IceCube detects the highest-energy neutrino ever.
- 2017–2018 – Neutrinos Point to Cosmic Accelerators: IceCube traces a neutrino back to a blazar 4 billion light-years away, ushering in multimessenger astronomy.
- 2020 – Sun’s Hidden Fusion Cycle: Borexino detects neutrinos from the CNO cycle, confirming a long-standing prediction about solar fusion.
Oscillation: the shape-shifting particle
Neutrinos do not keep a fixed flavor as they travel. A neutrino that starts as a muon neutrino can later be detected as an electron neutrino or tau neutrino. This is called neutrino oscillation.
Oscillation happens because the flavor states we detect are mixtures of the mass states that travel through space. That matters because the original Standard Model assumed neutrinos were massless. The discovery of oscillations showed that neutrinos have mass, so the Standard Model cannot be the whole story.
For a beam of muon neutrinos, one useful question is: what fraction are still muon neutrinos after traveling a distance \(L\) with energy \(E\)? A simplified survival probability is:
Don't worry about every symbol yet. The key idea is that the survival probability dips at certain energies. In the tutorials, that dip shows up as fewer muon-neutrino events in the far detector than we would expect without oscillation.
Standard Model of Particle physics
The standard model of particle physics is scientists' current best theory to describe the most basic building block of universe. It explains how partices called quarks make up all known matter.
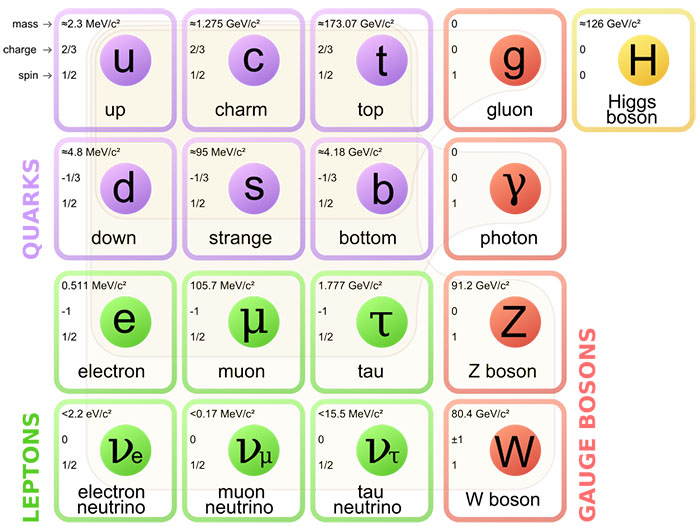
Although the Standard Model successfully explains many fundamental particles and interactions, it is not complete. The Higgs boson gives mass to quarks, charged leptons, and the W and Z bosons, but it does not explain the masses of neutrinos. Experiments have observed Neutrino Oscillation, where neutrinos change from one flavor to another as they travel. This process can only occur if neutrinos have mass, which the Standard Model does not account for, showing that the theory is incomplete. Additionally, most of the universe consists of Dark Matter and Dark Energy, which are also not explained by the Standard Model.
NOvA: seeing the dip
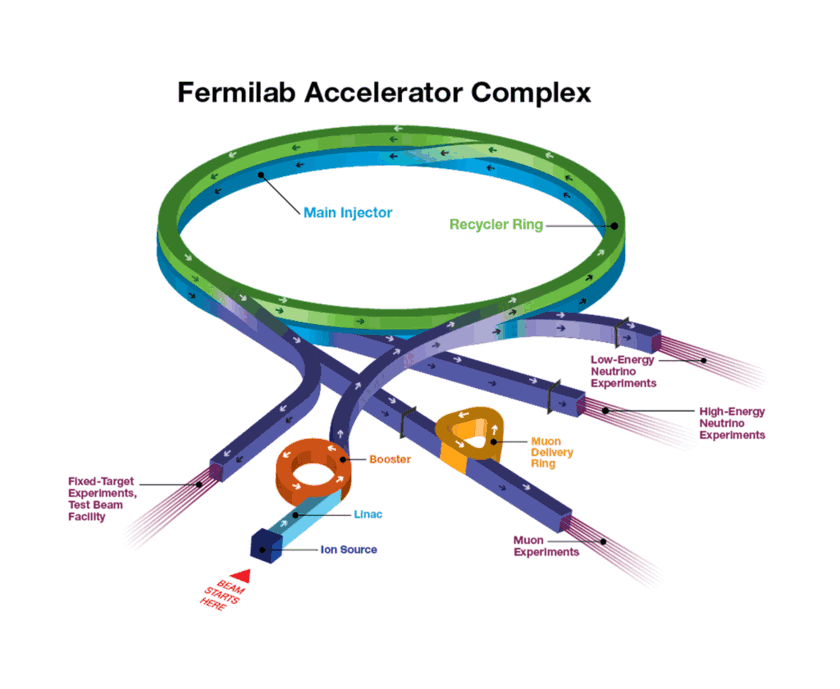
NOvA (NuMI Off-axis νₑ Appearance) is a Fermilab experiment designed to measure neutrino oscillations with two detectors and one neutrino beam.
- A beam of muon neutrinos is produced at Fermilab, near Chicago
- The beam travels 810 km underground to a detector in Ash River, Minnesota
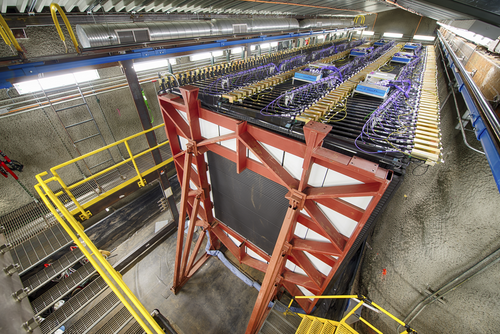
- A smaller near detector at Fermilab measures the beam before oscillation has had much effect
- The large far detector in Minnesota measures it after significant oscillation has occurred
- By comparing the two detectors, physicists measure the oscillation pattern
How the NuMI beam is made
- Protons are accelerated to 120 GeV in Fermilab's Main Injector, then fired into a graphite target about a meter long.
- The collision produces a spray of pions and kaons. Magnetic horns focus them, and they decay in flight — mostly into muons and muon neutrinos.
- The muons are absorbed downstream; the neutrinos keep travelling, forming the NuMI beam that reaches both the near and far detectors.
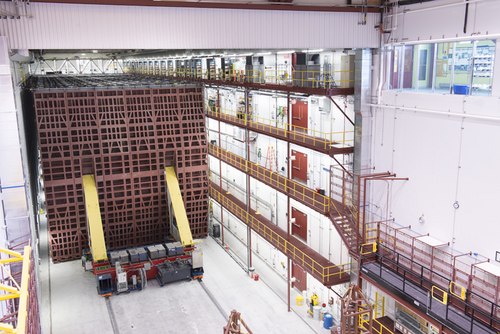
The far detector is a 14,000-tonne block of plastic filled with liquid scintillator — it glows faintly when a rare neutrino interaction occurs.
DUNE: the next generation
DUNE (Deep Underground Neutrino Experiment) will use the same basic near/far idea on a longer baseline. A neutrino beam from Fermilab will travel about 1,300 km to a huge liquid-argon detector at Sanford Underground Research Facility in South Dakota.
That longer trip gives oscillations more room to develop. DUNE is designed to measure the oscillation pattern with high precision, compare neutrinos with antineutrinos, and search for CP violation in the neutrino sector — one possible clue to why the universe contains more matter than antimatter.
In this program, NOvA gives us the tutorial-scale example: make spectra, compare near and far detectors, and find the dip. DUNE shows where the field is going next.
Flavour-eigenstate and Mass-eigenstate
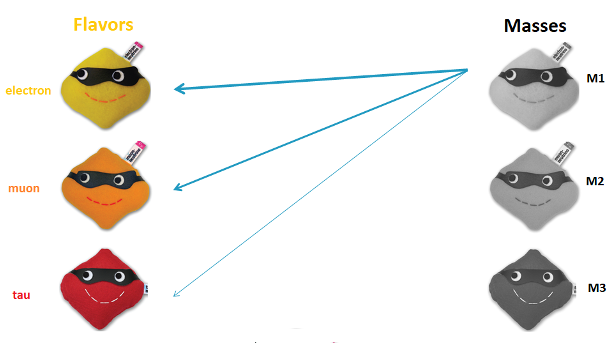
Neutrino Exists in two different states, one is flavor-eigen state and another is mass eigen state.Neutrinos are observed in the three flavors that correspond to the leptons (electron, muon, and tau) that are produced when the neutrinos interact.
In the simplest explanation for neutrino flavor change, the three neutrino flavors are quantum mechanical combinations of three neutrino mass states. This means that neutrinos travel as a combination of the three mass states rather than as a single, static flavor.
Why does this matter?
Neutrino oscillation tells us the neutrinos have mass — but the Standard Model says they shouldn't. That's a crack in our best theory of nature.
Neutrinos might also hold a clue to why the universe is made of matter rather than equal amounts of matter and antimatter. Experiments like NOvA and DUNE search for differences between neutrino and antineutrino oscillations. If those differences are real, they would point to new physics beyond the Standard Model.
Histograms in Neutrino Oscillation
In the neutrino tutorials, histograms give us a practical way to compare what a detector sees at different energies. A few common plot types are:
- Energy Spectrum
- PID Score
- Vertex Distribution
- L/E Distribution
Energy Spectrum:
This is one of the most useful plots for an oscillation tutorial. It shows the reconstructed neutrino energy for a set of selected events.
- The X-axis: neutrino energy, measured in GeV.
- The Y-axis: number of selected neutrino events.
In the near detector at Fermilab, the spectrum tells us what the beam looked like before much oscillation had time to develop. In the far detector, 810 km away, the spectrum can show a dip at particular energies. That dip is evidence that some muon neutrinos changed flavor before reaching the far detector.
PID Spectrum:
PID stands for Particle Identification. NOvA uses a "CVN" (Convolutional Visual Network)—basically a fancy AI—to look at pictures of particle tracks and guess what they are.
- The X-axis: probability score, from 0 to 1.
- The Y-axis: number of selected events.
If the AI is 90% sure an event is an electron neutrino, it puts a count in the 0.9 bin. If it's only 10% sure, it goes in the 0.1 bin. To be safe, scientists might say: "We only trust events with a score higher than 0.8." This is a selection cut. It removes the "fakes" and keeps the real signal.
Vertex Spectrum:
A "vertex" is the exact point where a neutrino hit an atom and exploded into other particles.
- The X/Y/Z axes: the physical location inside the detector.
- The plotted value: density of interactions.
We expect neutrinos to hit the detector evenly. If we see a huge "spike" of events near the edges of the detector, those aren't neutrinos—those are Cosmic Rays (background noise) leaking in from the outside.
We use a fiducial volume cut. We basically draw an invisible box inside the detector and "cut" any data that happened too close to the walls.
L/E Spectrum:
In NOvA, an L/E plot is useful because the oscillation phase depends on the ratio of baseline distance \(L\) to neutrino energy \(E\). The position of the dip helps constrain the mass-squared splitting \(\Delta m^2\).
By binning events according to distance divided by energy, we map out the wave-like oscillation probability. The dip in the histogram is related to the \(\sin^2\) term in the oscillation formula:
The NOvA/DUNE notebooks in this program use toy Monte Carlo, not restricted collaboration data. The toy samples are designed to make the same analysis ideas visible: spectra, ratios, fluctuations, and the oscillation dip.
Event displays: seeing a single interaction
A histogram summarizes thousands of events at once. An event display shows just one — the raw hits recorded when a single neutrino, or a single cosmic ray, passes through the detector.
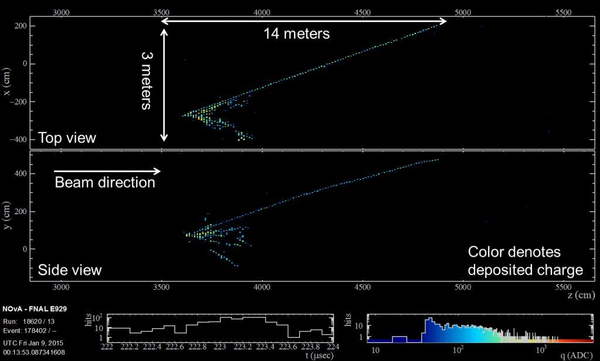
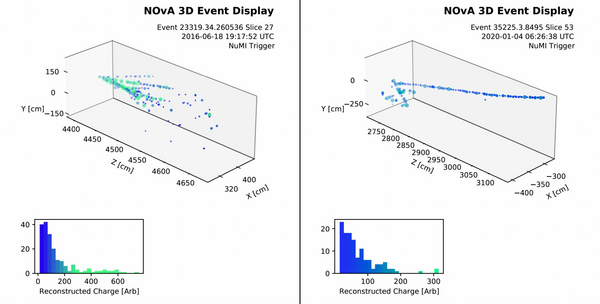
Reconstruction software finds the interaction vertex, the direction of each track, and — using the CVN classifier described above — what kind of particle made it. A long, straight track usually means a muon; a short, fuzzy shower usually means an electron.
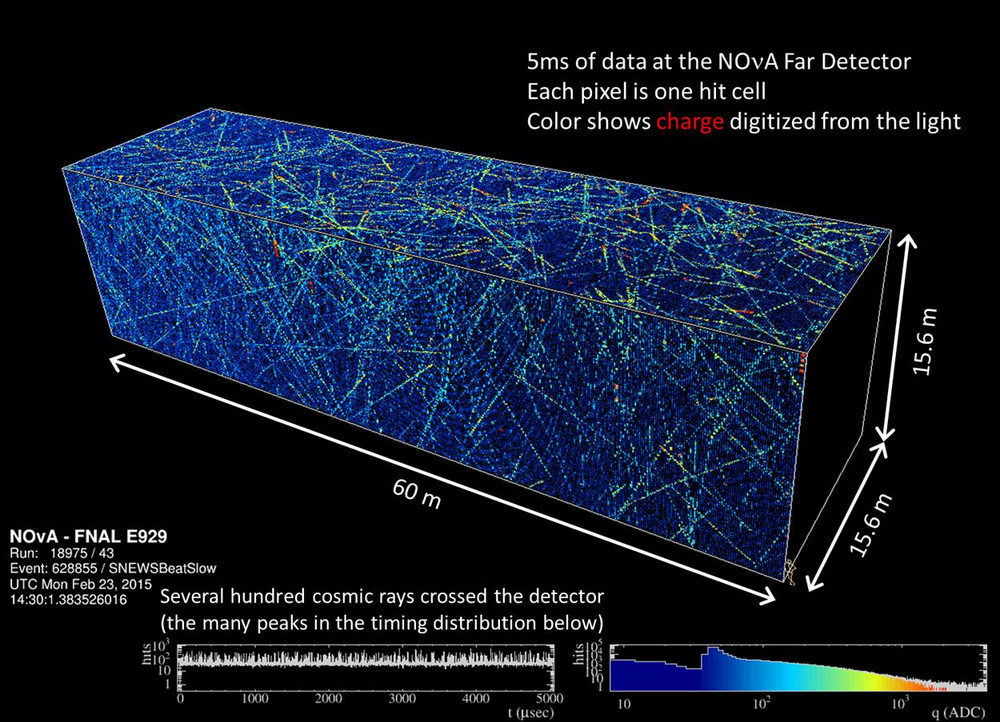
Most of what the far detector sees isn't neutrinos at all — it's cosmic rays. The image below shows 5 milliseconds of real far-detector data: hundreds of cosmic-ray tracks crossing the 15.6 m × 15.6 m × 60 m detector. This is exactly why analyses apply timing and fiducial-volume cuts — to isolate the rare beam-neutrino interactions from that background.
Ready to see the data? We'll work through the neutrino tutorial together during the program.